Courses / Eyes in the Sky / Universities & Professionals

Offered through the University of the West Indies

Eyes in
the Sky

Become the person who produces the analysis.

In one working session you go from zero to a satellite workflow you own: change detection, time-series, and AI land-cover classification on real Caribbean data. You leave able to open Earth Engine on Monday, point it at your own site, and produce the map yourself. No consultant, no licence fee, no waiting on someone overseas. The same open stack working scientists use, now in your hands.
3 hrsApplied session
5Core datasets
LiveCode on your own data
UWICertificate of completion

Why this is for you

Right Now, Someone Else Analyses Your Island. That Changes to You.

The data covering your island is free and arrives on a fixed schedule, yet most of the analysis that shapes the decisions around it is still made somewhere else. After this session, you are the one who can make it. You build a real workflow against Sentinel-2, Landsat, Hansen, and Dynamic World, and you walk out able to rebuild it on any site you choose, without asking anyone's permission.

Satellite data is one of the few areas in science where a professional in Mona has the exact same tools as a researcher at any agency on Earth. The gap is not access. It is the working session that turns access into capability. Adrian Dunkley, course instructor

Is this you?

Find Yourself Here, and Picture What You Walk Out Able to Do

If you are a student

You walk into your next lab, internship, or interview with a real geospatial skill on your record, not just a grade. You can already do what others are still reading about.

If you work in disaster and resilience

You become the person who can map damage and exposure the day after an event, in-house, instead of waiting on an outside report that arrives too late.

If you work in agriculture or environment

You can measure crops, drought, forest, and impact yourself, with evidence you produced, and defend it in the room where the decision is made.

If you work in planning or research

You turn a question about your coastline, your city, or your park into a map and a number the same afternoon, and stop outsourcing your own evidence.

What you will leave able to do

By Tomorrow Morning, You Can

Why you will be needed

The Region Is Short on People Who Can Do This

2024

Hurricane Beryl was the earliest Category 5 on record in the Atlantic. Rapid, local satellite analysis is now an operational need, not a research luxury.

NOAA National Hurricane Center
70%

of Jamaicans live in coastal areas, where change detection from satellites is most decision-relevant.

Planning Institute of Jamaica
5 days

the Sentinel-2 revisit interval over the Caribbean. A new 10m observation of your area, free, twice a week.

ESA Copernicus
1972

the start of the continuous Landsat record, so you can measure change across five decades.

NASA / USGS Landsat

The session

You Are on the Keyboard the Whole Way

You get to a live image fast, you learn the core operations by running them, and you put them together on a real Caribbean question that you present to Climate Studies Group researchers. You do not watch a demo. You build the thing.

Part 1 • 45 min

Foundations

The physics of what a sensor records, and the Earth Engine model. By minute 45 you have a live, cloud-filtered Sentinel-2 composite on screen.

  • Bands, spectral response, resolution, revisit
  • Collections, filters, and reducers in Earth Engine
  • A live Sentinel-2 composite over your area
Part 2 • 75 min

Applied Analysis

The three operations you will reuse constantly: change quantification, spectral indices and time-series, and classification.

  • Forest loss in hectares from Hansen
  • NDVI, difference maps, and a multi-year chart
  • Dynamic World classification and class statistics
Part 3 • 60 min

Applied Capstone

You and your team take one real Caribbean question end to end, with starter code, and present a result you can defend to UWI researchers.

  • Scope a question and pick the datasets
  • Build a reproducible workflow and a figure
  • Present the method, the result, and the action

The working style

The Code You Run Is the Code the Pros Run

No pseudo-code, no black boxes, no training wheels. You write and run the same JavaScript that production geospatial work uses, starting with a cloud-sorted Sentinel-2 composite. When you leave, this is yours to keep using.

// Define an area of interest, then the clearest recent scene
var aoi = ee.Geometry.Point([-77.2975, 18.1096]);  // swap for your site
Map.centerObject(aoi, 9);

var image = ee.ImageCollection('COPERNICUS/S2_SR_HARMONIZED')
  .filterBounds(aoi)
  .filterDate('2024-01-01', '2024-04-30')
  .sort('CLOUDY_PIXEL_PERCENTAGE')
  .first();

Map.addLayer(image, {bands: ['B4','B3','B2'], min: 0, max: 3000}, 'True colour');

The applied capstone

Pick One. Drive It From Question to Answer. Own the Result.

You choose one and take it the whole way, from question to defensible answer. Each maps to a real professional workflow, and every brief ships with starter code, so your time goes on method, not boilerplate. The result is yours to show.

A

Rapid Damage Assessment

Quantify the vegetation loss from Hurricane Beryl in St. Elizabeth, before versus after.

Sentinel-2 NDVI difference

B

Urban Heat & Equity

Map the hottest Kingston neighbourhoods and test them against tree cover.

Landsat thermal + Dynamic World

C

Coastal Change

Measure how the Portmore shoreline has moved across 40 years of water data.

JRC Global Surface Water

D

Protected-Area Integrity

Test whether the Blue Mountains National Park is holding, by forest loss inside its boundary.

Hansen within park polygon

The production stack

This Whole Stack Becomes Yours to Command

These are not demos. They are the exact datasets you point at your own sites, and after this session you know how to reach every one of them by name.

Sentinel-2 COPERNICUS/S2_SR_HARMONIZED Landsat 9 LANDSAT/LC09/C02/T1_L2 Hansen GFC UMD/hansen/global_forest_change_2023_v1_11 Dynamic World GOOGLE/DYNAMICWORLD/V1 JRC Surface Water JRC/GSW1_4/GlobalSurfaceWater

Your instructor

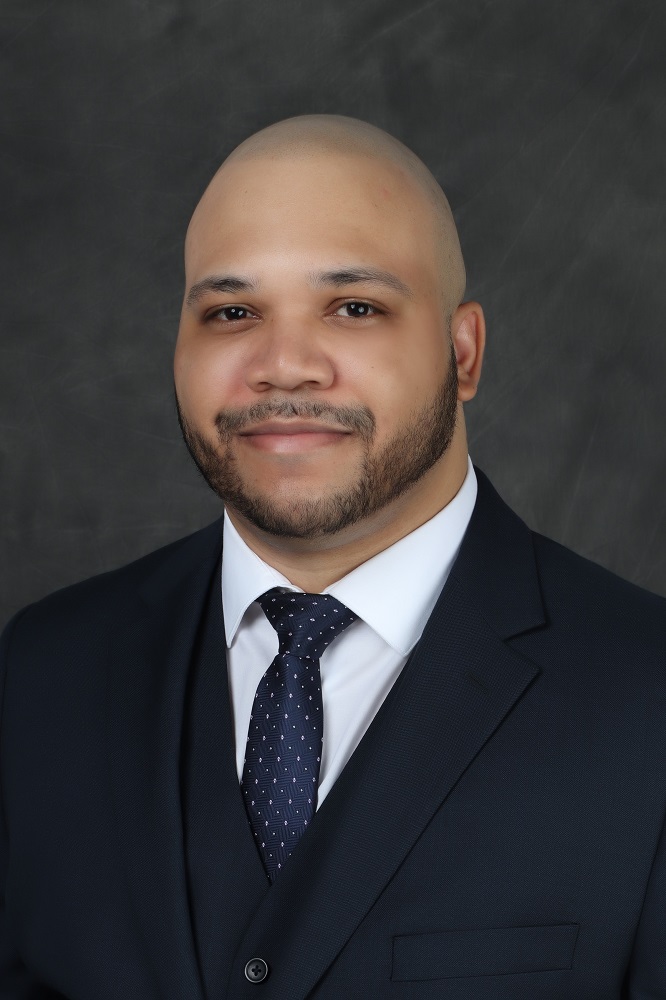
Taught by Adrian Dunkley

Adrian Dunkley
Adrian Dunkley
Scientist • Entrepreneur • Award-winning AI Builder

Adrian Dunkley teaches satellite data analysis with the Climate Studies Group, Mona, at The University of the West Indies. He is a scientist and entrepreneur, founder of StarApple AI, and works at the meeting point of physics, data, and applied machine learning.

He runs this session the way a working lab runs: real datasets, real code, and a capstone judged on whether the analysis actually answers the question. The goal is not a demo you watched, but a workflow you can rebuild on your own data the next morning.

The academic home

Climate Studies Group, Mona

The Climate Studies Group, Mona is the Caribbean's foremost body of climate scientists, based in the Department of Physics at The University of the West Indies. For more than 35 years it has studied Caribbean climate and advised CARICOM, CIMH, national met services, and the United Nations. Professor Tannecia Stephenson of the group was the only Caribbean small-island scientist on the IPCC Sixth Assessment Report Working Group I Summary for Policymakers team.