
The exchange as the system renders it. Each tower is a listed company, placed in a sector district and scaled by capitalisation, tagged with its last traded price. Green tags are advancing, red declining.
The Jamaica Stock Exchange is a small market by global measure and a difficult one by every measure that matters to a modelling problem. It is thin. A single institutional order can move a Junior Market listing several per cent. Reporting is quarterly and sparse. The macroeconomic series that drive it, the Bank of Jamaica policy rate, inflation, the exchange rate, quarterly GDP, arrive at different cadences and revise afterwards. None of the assumptions that make a large liquid market tractable hold here.
I chose it because of that difficulty. Techniques calibrated on the S&P 500 assume continuous trading, deep order books, and a news flow dense enough that sentiment can be treated as a smooth signal. Point them at a market where a listing may not trade for a session and they produce confident nonsense. A model that works on the JSE has to be built for the JSE.
Here is what is running, layer by layer.
Layer One: Ingestion and Calibration
The system pulls the full list of securities across the Main Market and the Junior Market, their sector classifications, their daily price and volume history, and the published macroeconomic series. Alongside that it takes a live feed of financial news covering the listed companies and the wider Jamaican economy.
Every parameter in the price engine is fitted to these historical series. For each security the system estimates its own volatility, its correlation with its sector and with the index, the autocorrelation structure of its returns, how often it trades at all, and how far it typically moves on a day when it does. Scotia Group Jamaica, capitalised at J$131.2 billion with a 52-week range of 40.37 to 66.96 and a dividend yield of 3.1 per cent, produces a very different parameter set from a Junior Market listing that changes hands twice a week.
Calibration decides whether anything downstream is useful. A simulation calibrated on generic market assumptions produces a generic market. Fitted to the actual return distributions of actual JSE securities, it produces something whose statistical fingerprint resembles the exchange it is named after.
Layer Two: A Price Engine Grounded in Physics
The behaviours that make a price series look real are specific and well documented. Prices drift. They disperse over time in proportion to the square root of that time. They revert towards levels they have wandered from. Their volatility clusters, so that violent sessions arrive in runs rather than independently. And they occasionally gap in a way no continuous process explains.
Each of those behaviours has a direct counterpart in physics. Louis Bachelier modelled prices as a random walk in 1900, and Einstein published the same diffusion mathematics for Brownian motion in 1905; it later became the basis of the Black-Scholes framework. Mean reversion is the Ornstein-Uhlenbeck process, which is a damped spring with noise. Volatility clustering is relaxation: a system knocked out of equilibrium stays agitated for a characteristic time before settling. Gaps are jump processes.
So the engine treats each listed security as a body. It has a position, which is its price. It has momentum, carried from recent returns. And it has mass, set by its liquidity and capitalisation. Forces act on it from four directions: its sector, the macroeconomic state, its own mean-reverting pull towards a fitted fair value, and whatever the news layer has just done to it.
Mass matters most. An identical piece of news applied to a large, liquid, heavily capitalised bank and to a thinly traded Junior Market name produces very different accelerations, because the same force divided by different masses gives different results. That single choice reproduces one of the most reliable features of a small exchange, the wild sensitivity of its smallest listings, without anybody hand-tuning a volatility multiplier for each security.

Gustav Kalhammer, Berlin: Stock Exchange (Die Börse), 1911. The Metropolitan Museum of Art, public domain.
Layer Three: Generative News and the Sentiment Loop
Real prices move when information arrives, and most information arrives as text.
A language model synthesises the market's news flow, conditioned on two things at once: the state the simulated market is currently in, and the real reporting calendar, so that a company due to report does so at the right time. The output is the ordinary journalism of a small exchange. Quarterly earnings with the numbers attached. Regulatory notices. Dividend declarations. Sector pieces on tourism arrivals or on the effect of a policy rate decision on bank margins.
The generation is constrained. A company that has been losing ground for three weeks does not wake up to an unexplained profit story, because the conditioning includes its recent trajectory. Where the model does produce a surprise it is drawn deliberately from a tail, at a rate fitted to how often real surprises occur, because a market without them teaches something false.
The text is then scored for sentiment and directed back into the price engine as a force on the named security and, at lower weight, on its sector. Narrative moves price, price conditions the next round of narrative, and the two evolve together as they do in a real market.
The same pipeline consumes real news. Ingesting live coverage, scoring it, and mapping it onto the affected securities is what a research desk does. Building it inside a simulation means it can be evaluated against outcomes the system already holds, which is cheaper than evaluating it live with capital attached.
Layer Four: The Fourteen-Day Forward Distribution
The forecast runs the whole apparatus forward several thousand times in parallel, each path carrying its own generated news, its own macroeconomic realisation, and its own draws from the stochastic engine. The paths are then collapsed into a distribution for each listed security fourteen sessions out.
The output is a set of quantiles and a probability of finishing above or below a given level, with no single target price. A single number invites belief. A distribution shows the full shape: a central case among many, an interval that widens with horizon, and a tail in which a position that looks comfortable at the median is ruinous.
Macroeconomic conditioning runs on the same ensemble. Policy rate paths, inflation, and exchange rate movement follow standard, published relationships, so an assumed rate change propagates in the observed order: into bank margins first, into consumer-facing names later, into small capitalisations hardest.
Quality is assessed by calibration before accuracy. A forecast that assigns seventy per cent probability to an outcome should be right about seventy per cent of the time across many such calls. Reliability of that kind can be measured, and it matters more than any single good call. The system is also scored on the sharpness of its intervals, because a forecast wide enough to be always right says nothing. And it is scored against a naive random-walk baseline, because any market model that cannot beat a random walk has earned no confidence at all. Those evaluations are running now and I will publish the numbers when there are enough sessions behind them to be worth reporting.
The interface: the exchange as a city
People remember places more easily than tables, and a table of forty tickers teaches nobody the structure of a market.
Each listed company is a tower, positioned in a district by sector and scaled by capitalisation. Banking and finance occupies one quarter of the map, agriculture another. Height and lighting track how a company is trading. Sector rotation, which is a column of percentages in any brokerage interface, becomes something you can see from across the city: one district dimming while another lifts.
The macroeconomic strip sits across the top. JSE Combined at 394,660, the Junior Market at 2,881, the policy rate at 5.75 per cent, inflation at 5.2, the exchange rate at J$158 to the US dollar, GDP at negative 0.3. These are inputs, and the market underneath responds to them.
Click a tower and you get the security: sector, capitalisation, 52-week range, dividend yield, liquidity, and a price chart carrying 20-day and 50-day moving averages, Bollinger bands, and RSI. Then a position box with fees included in the cost before you commit. Time advances one session every five seconds, and you can pause it or push it to triple pace to watch a position develop over months.
You start with a million Jamaican dollars. You can also close the panels and walk the streets. People who do tend to start asking what the buildings are.
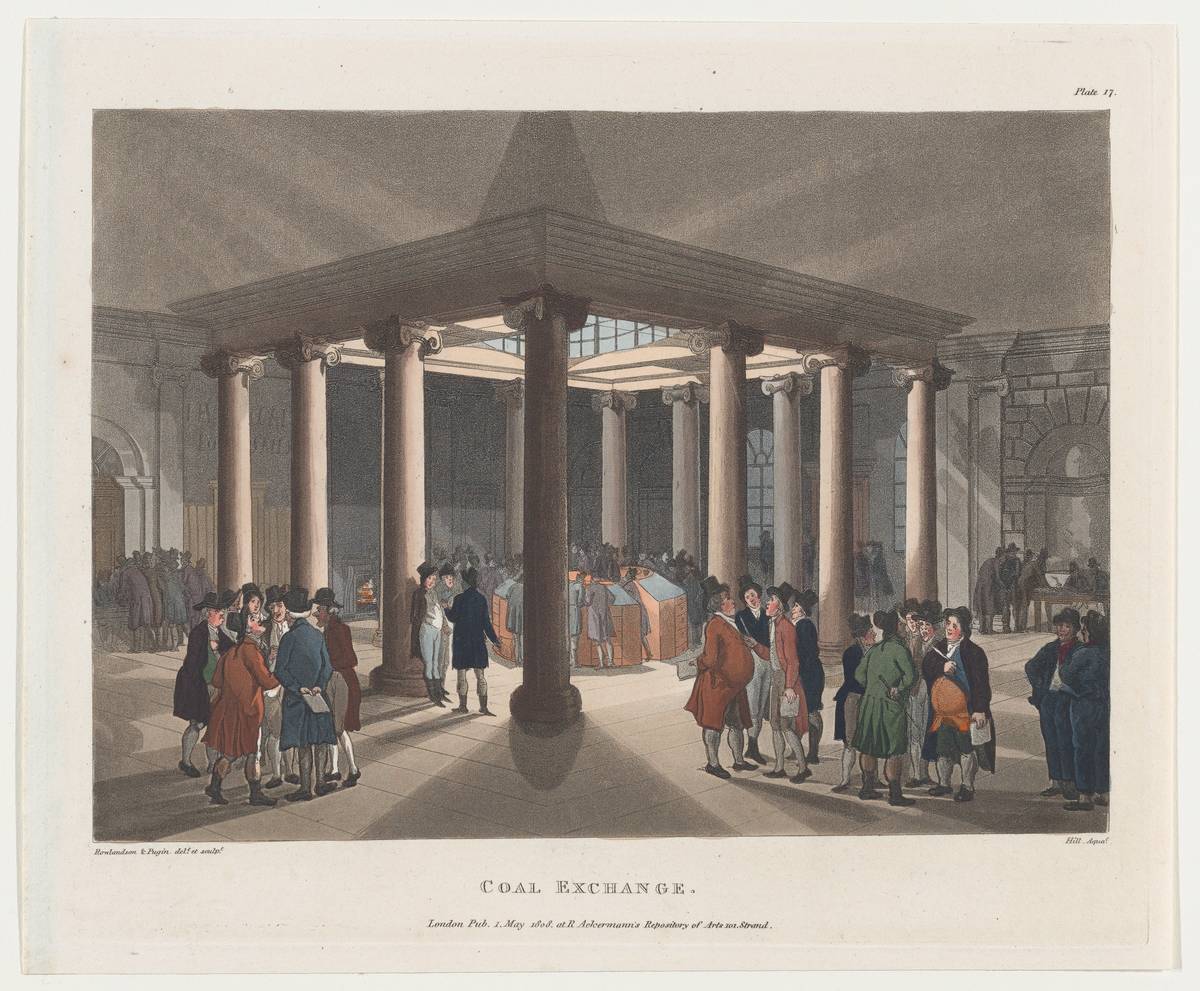
Thomas Rowlandson, Coal Exchange, May 1, 1808. The Metropolitan Museum of Art, public domain.
Why a simulator helps first-time Jamaican investors
Many Jamaicans save every month, through a partner draw for example, and never buy a Jamaican share. The exchange is invisible to them, it uses a vocabulary nobody taught them, and they first meet it when a broker asks for a signature.
A simulation solves a specific part of that. Losing two hundred thousand simulated dollars by concentrating a portfolio into one Junior Market listing ahead of an earnings release is a cheap lesson delivered at the right time. The same lesson delivered once, for real, is usually enough to keep a person out of the market permanently.
What it teaches is mechanical and temperamental in equal measure: what you actually pay once fees are counted, what a 3.1 per cent dividend yield means against a 5.75 per cent policy rate, why a high-liquidity security absorbs news that would move a thin one violently, and why owning eight banks is not a diversified portfolio. Holding through a drawdown feels a particular way, and it is better to feel it the first time with money that is not yours.
A second point, for Jamaican organisations told that this class of system requires an overseas vendor and a twelve-month engagement. Every component here is generally available. Language models, stochastic methods that have been in the literature for fifty years, financial data APIs, and a browser that renders a city at sixty frames a second. What is new is that one person can assemble them into a running market in a reasonable stretch of time.
Limitations: where the model is weakest
The calibration is bounded by the history behind it, and for a market this size some listings have thin, gappy, awkward series. Parameters fitted to forty trading days carry a great deal less weight than parameters fitted to a thousand, and the system's confidence in those names should be read accordingly.
The news layer produces plausible journalism, which may still misrepresent what a small exchange reports. A generative model reproduces the distribution of what it was trained to produce, which is not identical to the distribution of what a small exchange actually reports.
Any simulation is smoother than the market it describes. The real exchange includes settlement delays, a broker who does not answer the phone, a listing suspended pending an announcement, and the session cancelled because a hurricane is crossing the island. They are part of the return an investor receives, and they are absent here.
And nothing in this is investment advice. I am not a licensed adviser, the output is a probability distribution rather than a recommendation, and anyone acting on it is making their own decision with their own money.
What to do next
The evaluation record needs more sessions before I publish calibration curves, and the news pipeline still has to be scored on live coverage by itself. Those are my jobs. These are the ones for readers.
- Secondary school teachers and principals: email insights@starapple.ai to request a one-term classroom pilot, with students keeping a written trading journal that the teacher reviews weekly.
- Credit unions and brokerages: run a member session where each person manages a simulated J$1 million portfolio for two weeks, then compare results and fees together.
- First-time investors: trade the simulation for a month first. Then open an account with a licensed member dealer and start with an amount you could leave untouched through a large fall.
- Analysts and developers: before building anything complex, fit a random-walk baseline to JSE daily data and score it. Any model you build later has to beat that number.
Frequently Asked Questions
Can I buy real Jamaica Stock Exchange shares through the simulator?
No. The simulator uses play money only. To invest for real you open an account with a JSE member dealer, a brokerage licensed by the Financial Services Commission, and the exchange publishes the current list of member dealers on its website. Ask each dealer for its full fee schedule and minimum account size before choosing.
What is the difference between the Main Market and the Junior Market?
The Junior Market, launched in 2009, is for smaller companies. Listed firms receive a remission of income tax for their first ten years, full for five years and half for the next five, provided they stay listed and meet the rules. Junior Market shares are usually thinner and more volatile, which is why the simulator treats them as light bodies that move sharply on news.
Where can I get JSE and Jamaican economic data for my own analysis?
The Jamaica Stock Exchange publishes daily trading summaries, company announcements and financial statements on its website. The Bank of Jamaica publishes the policy rate, inflation and exchange rate series, and the Statistical Institute of Jamaica (STATIN) publishes GDP. Expect gaps and revisions, especially in older price series for small listings.
How can I check whether any forecast, including this one, is calibrated?
Record every probabilistic call before the outcome is known, then group the calls by stated probability and compare each group with how often the event happened. If calls made at 70 per cent came true about 70 per cent of the time, the forecaster is calibrated. The Brier score summarises this in one number, and comparing it with a simple random-walk baseline tells you whether the model adds anything.
What does a real JSE trade cost?
Each trade carries a broker commission plus exchange and regulatory fees, and you pay them when you buy and again when you sell. Many dealers charge a minimum fee, so on small orders the percentage cost can be high. Ask your dealer for a worked example on the trade size you plan to make, and include both sides of the trade when judging whether a position made money.
If you run a school, a credit union, a brokerage, or a training programme and a simulated Jamaica Stock Exchange would be useful to the people you teach, I would like to hear from you. Reach me at insights@starapple.ai.
See the AI Boss Tools